I'm going to use a free data set found on Azure Market Place for this example. It is the GDP By State Estimates of Compensation (1997-2011) set.
Description of "Awesomeness": I learned how to take a pivot table that has filtering options and create an individual spreadsheet with a table reflecting the data for each of the items listed in the filter(s).
**Update: this is not available for PowerPivot Pivot tables... http://powerpivotfaq.com/Lists/TGPPF/DispForm.aspx?ID=78 **
Here's how:
Create a pivot table and add a filter:
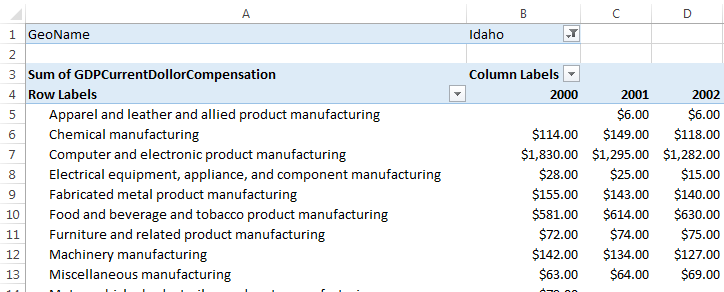
In this case, I have used the "GeoName" (state name) as my filter.
Next, click anywhere on the pivot table and go up to the Ribbon at the top. Click "Analyze" under "PIVOTTABLE TOOLS". Click on the "Options" drop down in the pivot table option set on the left (See image below):
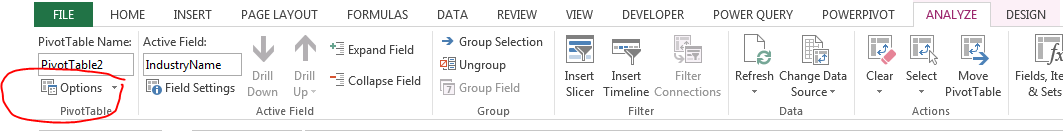
Now, Click on "Show Report Filter Pages..."
A pop-up will appear and ask you to select which filter to use. I click on GeoName then OK. The final result is a new spreadsheet for each of the filter options that has a pivot table based on the original data source!!

I know, it's pretty sweet.
Yeah... OK. That's pretty sweet. I'm gonna use that for sure!
ReplyDelete